What Is Cloud Peering and Why MarQi Cloud’s Network Architecture Is Different
June 25, 2026
How MarQi Cloud Supports Multi-Tenant Applications Without Compromising Performance
June 26, 2026
How MarQi Cloud’s Monitoring Dashboard Gives You Real-Time Infrastructure Visibility
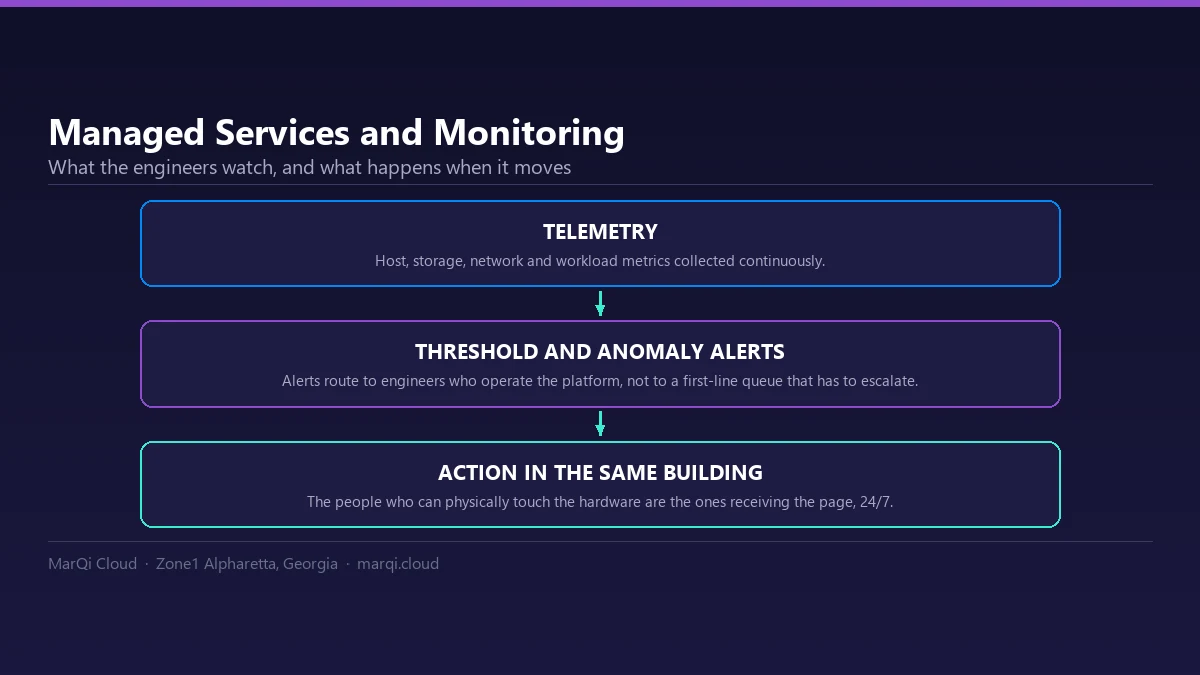
In today’s fast-paced digital landscape, businesses require not only robust cloud infrastructure but also reliable tools to monitor and manage that infrastructure effectively. Enter MarQi Cloud’s innovative Monitoring Dashboard, designed to provide real-time visibility into your cloud resources and performance. This article delves into the features and benefits of our Monitoring Dashboard, illustrating how it enhances operational efficiency and ensures business continuity.
Understanding the Importance of Infrastructure Monitoring
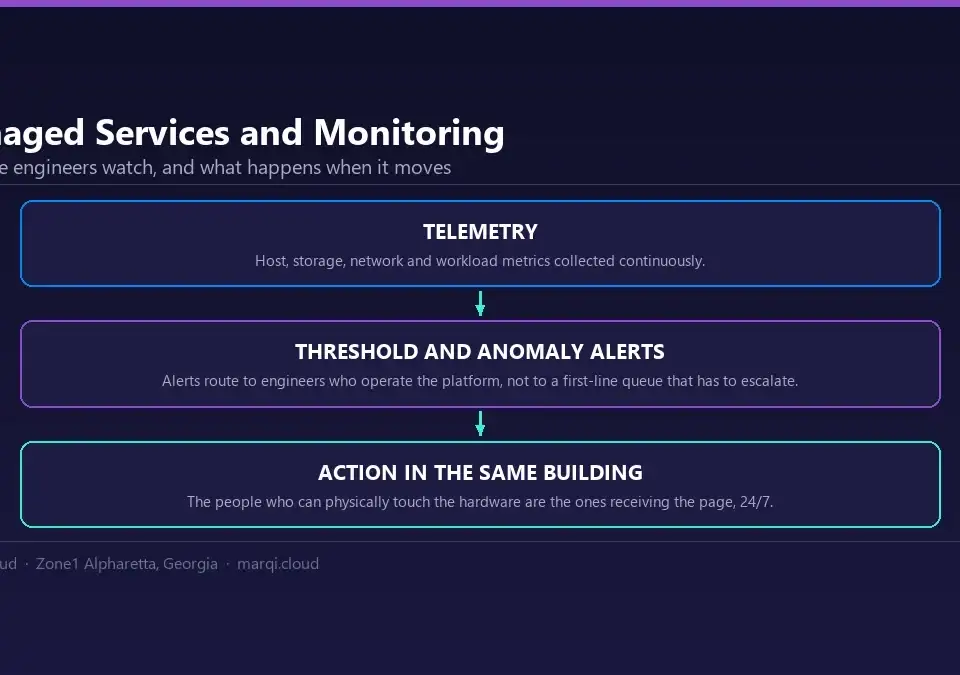
Infrastructure monitoring is a critical aspect of cloud management. It enables organizations to track the performance, health, and availability of their cloud resources, thus minimizing downtime and optimizing resource utilization. With MarQi Cloud’s Monitoring Dashboard, users gain an integrated view of their entire cloud environment, allowing for proactive management and swift response to potential issues.
Key Features of MarQi Cloud’s Monitoring Dashboard
1. Real-Time Data Visualization
One of the standout features of the Monitoring Dashboard is its ability to provide real-time data visualization. Users can view essential metrics such as CPU usage, memory consumption, and network traffic at a glance. The intuitive graphical interface simplifies complex data, making it easier to understand and act upon.
2. Customizable Alerts and Notifications
Our Monitoring Dashboard allows users to set up customizable alerts based on specific thresholds. Whether it’s CPU usage exceeding 80% or disk space dropping below a predefined limit, users can receive instant notifications via email or SMS. This proactive alerting system ensures that potential issues are addressed before they escalate into significant problems.
3. Comprehensive Reporting Tools
The dashboard includes powerful reporting tools that allow users to generate detailed reports on infrastructure performance over time. These reports can be invaluable for assessing trends, identifying bottlenecks, and making informed decisions about resource allocation and optimization.
4. Integration with Third-Party Tools
MarQi Cloud’s Monitoring Dashboard seamlessly integrates with various third-party tools and platforms, enhancing its functionality. Users can connect popular services for logging, alerting, and incident management, creating a comprehensive monitoring ecosystem tailored to their needs.
5. User-Friendly Interface
Designed with user experience in mind, the Monitoring Dashboard features a clean and intuitive interface. Users can easily navigate through different metrics and reports, ensuring they can find the information they need quickly without unnecessary complexity.
Benefits of Using MarQi Cloud’s Monitoring Dashboard
1. Enhanced Operational Efficiency
With real-time visibility into infrastructure performance, businesses can operate more efficiently. By identifying and addressing issues proactively, teams can reduce downtime and improve service levels.
2. Improved Decision-Making
Access to comprehensive data allows organizations to make informed decisions regarding capacity planning, resource allocation, and budget management. This data-driven approach ensures that businesses can scale effectively without overspending.
3. Increased Security and Compliance
Monitoring infrastructure is crucial for maintaining security and compliance. By keeping an eye on user activity and resource usage, organizations can quickly identify unauthorized access attempts or potential misconfigurations, thereby safeguarding sensitive data.
4. Better Resource Management
The Monitoring Dashboard provides insights into resource utilization, helping organizations optimize their cloud spending. By understanding resource usage patterns, businesses can adjust their deployments and avoid unnecessary costs.
5. Streamlined Troubleshooting
When issues arise, having real-time visibility makes troubleshooting significantly easier. The dashboard’s detailed metrics and logs allow IT teams to quickly pinpoint the root cause of problems, reducing the time it takes to resolve incidents.
Implementing MarQi Cloud’s Monitoring Dashboard
Getting started with MarQi Cloud’s Monitoring Dashboard is straightforward. Existing customers can easily enable the dashboard through their existing cloud management console. New users can sign up for our services and gain immediate access to the Monitoring Dashboard as part of their package.
Real-World Case Studies
To illustrate the effectiveness of the Monitoring Dashboard, consider the following case studies:
Case Study 1: E-Commerce Platform
An e-commerce company experienced high traffic during holiday seasons, leading to performance issues. By utilizing the Monitoring Dashboard, they set up alerts for peak usage times and identified resource bottlenecks. As a result, they scaled their infrastructure dynamically, resulting in a 30% increase in sales and zero downtime during peak periods.
Case Study 2: SaaS Provider
A SaaS provider struggled with compliance due to inconsistent monitoring of user activity. By implementing the Monitoring Dashboard, they gained visibility into user interactions and resource access. This proactive monitoring not only enhanced security but also helped them achieve compliance with industry regulations.
Conclusion
MarQi Cloud’s Monitoring Dashboard is an essential tool for organizations looking to optimize their cloud infrastructure management. With real-time visibility, customizable alerts, and powerful reporting capabilities, businesses can enhance operational efficiency, improve decision-making, and ensure business continuity. As the digital landscape continues to evolve, leveraging the power of our Monitoring Dashboard will empower organizations to stay ahead of the curve.
Frequently Asked Questions (FAQ)
1. What is MarQi Cloud’s Monitoring Dashboard?
The Monitoring Dashboard is a tool that provides real-time visibility into your cloud infrastructure, allowing you to monitor performance metrics, set alerts, and generate reports.
2. How does real-time monitoring benefit my business?
Real-time monitoring helps businesses quickly identify and address issues, reducing downtime and improving overall service levels.
3. Can I customize alerts in the Monitoring Dashboard?
Yes, you can set customized alerts based on specific performance thresholds to receive notifications when issues arise.
4. Is the Monitoring Dashboard user-friendly?
Yes. The Monitoring Dashboard is designed with a clean and intuitive interface for easy navigation and data access.
5. How can I generate reports using the dashboard?
The dashboard includes comprehensive reporting tools that allow you to generate detailed performance reports over specific time periods.
6. Can I integrate other tools with the Monitoring Dashboard?
Yes, the Monitoring Dashboard supports integration with various third-party tools and platforms for enhanced functionality.
7. How do I get started with the Monitoring Dashboard?
Existing customers can enable the dashboard through their cloud management console, while new users can sign up for MarQi Cloud services to gain immediate access.
8. What types of metrics can I monitor?
You can monitor a variety of metrics, including CPU usage, memory consumption, network traffic, and much more.
9. Is there support available for using the Monitoring Dashboard?
Yes, MarQi Cloud offers US-based infrastructure and support to assist you with any questions or issues regarding the Monitoring Dashboard.
10. How does the Monitoring Dashboard enhance security?
By providing visibility into user activity and resource usage, the Monitoring Dashboard helps quickly identify unauthorized access attempts and potential vulnerabilities.