MarQi Cloud Infrastructure as Code: The Terraform Templates You Need
April 26, 2026
The MarQi Cloud Security Hardening Checklist: Lock Down Your Infrastructure Today
April 27, 2026
How to Monitor MarQi Cloud Resources With Grafana and Prometheus
Introduction
Monitoring cloud resources is crucial for any business leveraging cloud infrastructure. With the rise of enterprise-grade cloud solutions like MarQi Cloud, ensuring that your resources are performing optimally is essential. This article explores how to leverage Grafana and Prometheus to monitor MarQi Cloud resources effectively.
Understanding MarQi Cloud
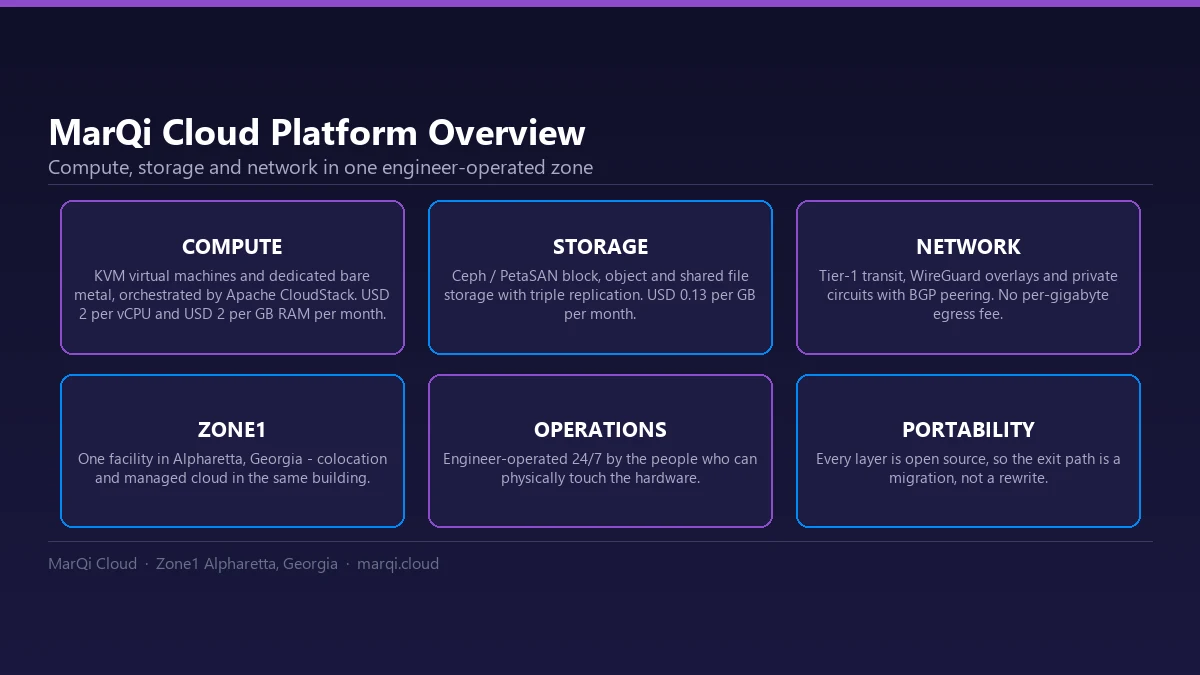
MarQi Cloud provides an enterprise-grade cloud infrastructure that supports hybrid deployment models with private and secure hosting environments. It offers scalable compute and storage resources, business continuity, and disaster recovery solutions, ensuring a performance-driven infrastructure design. Understanding these features is essential for effective monitoring.
Why Use Grafana and Prometheus?
Grafana and Prometheus are two powerful open-source tools for monitoring and visualization. Prometheus is a time-series database that collects metrics from configured targets at specified intervals, while Grafana is a visualization tool that allows users to create interactive and informative dashboards. Together, they provide a comprehensive monitoring solution for cloud resources.
Setting Up Prometheus
Step 1: Install Prometheus
To start monitoring MarQi Cloud resources, the first step is to install Prometheus. This can be done on various operating systems, including Linux and Windows. For Linux users, you can use the following commands:
curl -LO https://github.com/prometheus/prometheus/releases/download/vX.Y.Z/prometheus-X.Y.Z.linux-amd64.tar.gz
tar xvf prometheus-X.Y.Z.linux-amd64.tar.gz
cd prometheus-X.Y.Z.linux-amd64
./prometheus --config.file=prometheus.yml
Step 2: Configure Prometheus
After installing Prometheus, you need to configure it to scrape metrics from your MarQi Cloud resources. Modify the prometheus.yml file by adding your targets:
scrape_configs:
  - job_name: 'marqi-cloud'
    static_configs:
      - targets: [':']
Setting Up Grafana
Step 1: Install Grafana
Next, you need to install Grafana. Similar to Prometheus, Grafana can be installed easily via package managers or downloaded from the official website. For example, on Ubuntu, you can run:
sudo apt-get install -y software-properties-common
sudo add-apt-repository ppa:grafana/stable
sudo apt-get update
sudo apt-get install grafana
sudo systemctl start grafana-server
sudo systemctl enable grafana-server
Step 2: Configure Grafana
After installation, access the Grafana UI by navigating to http://localhost:3000 in your web browser. The default login credentials are admin/admin. Once logged in, add Prometheus as a data source:
- Go to Configuration > Data Sources.
- Select Add data source.
- Choose Prometheus.
- Fill in the URL (e.g., http://localhost:9090) and click Save & Test.
Creating Dashboards
Step 1: Create a New Dashboard
In Grafana, you can create interactive dashboards to visualize the metrics collected by Prometheus. To create a new dashboard:
- Click on the plus icon in the left sidebar and select Dashboard.
- Click on Add new panel.
Step 2: Add Metrics to Panels
In the new panel, you can select the metrics you want to visualize. For instance, to monitor CPU usage:
sum(rate(container_cpu_usage_seconds_total{image!=""}[5m])) by (instance)Setting Up Alerts
Step 1: Configure Alerting in Grafana
Grafana allows you to set up alerts based on the data metrics. To set up alerts:
- In your panel settings, navigate to the Alert tab.
- Click on Create Alert.
- Set the conditions for the alert, such as when CPU usage exceeds a certain threshold.
Best Practices for Monitoring MarQi Cloud Resources
Regularly Review Dashboards
It is essential to review your dashboards regularly to ensure metrics are being collected accurately and that the data reflects current resource usage.
Utilize Annotations
Annotations in Grafana help track changes or incidents that may impact metrics. Use them to mark events like deployments or outages.
Integrate with Notification Channels
Integrate Grafana with notification channels like Slack or Email to ensure your team is promptly informed about any issues or alerts.
Conclusion
Monitoring MarQi Cloud resources with Grafana and Prometheus is a robust solution for maintaining optimal performance and availability. By following the steps outlined in this article, you can set up an effective monitoring system that leverages the capabilities of both tools. This proactive approach will help ensure your cloud resources are functioning at their best, providing you with the scalability and reliability expected from enterprise-grade cloud infrastructure.
FAQ
1. What is MarQi Cloud?
MarQi Cloud is an enterprise-grade cloud infrastructure offering hybrid cloud deployment models, private hosting environments, and scalable resources.
2. Why should I use Grafana and Prometheus?
Grafana and Prometheus provide a powerful, open-source solution for monitoring and visualizing cloud resources effectively.
3. How do I install Prometheus?
Prometheus can be installed using package managers or by downloading the binaries from the official GitHub repository.
4. Can I set up alerts in Grafana?
Yes, Grafana allows users to set up alerts based on specific metrics and conditions.
5. What types of metrics can I monitor?
You can monitor various metrics including CPU usage, memory consumption, disk I/O, and network traffic.
6. How often does Prometheus scrape metrics?
Prometheus scrapes metrics based on the intervals specified in the configuration file.
7. Is Grafana free to use?
Yes, Grafana is open-source and free to use, with additional enterprise features available for a fee.
8. How can I integrate Grafana with Slack?
You can integrate Grafana with Slack by configuring notification channels in the Grafana UI.
9. What are the benefits of using a hybrid cloud model?
A hybrid cloud model allows businesses to enjoy the flexibility of both public and private cloud resources, optimizing costs and performance.
10. How can I ensure data security in MarQi Cloud?
Implement best practices such as encryption, access controls, and regular security audits to ensure data security in MarQi Cloud.