API Hosting for SaaS: Designing for Performance and Reliability
March 7, 2026
Cloud Networking Basics: CIDR Planning for Fast Growth
March 7, 2026
Observability Stack: Metrics, Logs, Traces—What to Implement First
In today’s fast-paced digital landscape, organizations rely heavily on their applications and services to deliver seamless user experiences. To ensure optimal performance and reliability, businesses must adopt robust observability practices. This article explores the observability stack, focusing on metrics, logs, and traces, and provides guidance on what to implement first for effective monitoring and troubleshooting.
What is Observability?
Observability refers to the ability to measure and understand the internal states of a system based on the external data it generates. It is a critical aspect of modern software development and operations, particularly in complex, distributed environments. Observability enables teams to gain insights into system performance, identify issues proactively, and enhance overall reliability.
The Importance of an Observability Stack
An observability stack is a collection of tools and practices that organizations use to collect, analyze, and visualize data from their systems. By implementing an observability stack, teams can:
- Improve application performance and reliability
- Detect and resolve issues faster
- Enhance user experience
- Facilitate informed decision-making
- Minimize downtime and prevent costly outages
The Three Pillars of Observability
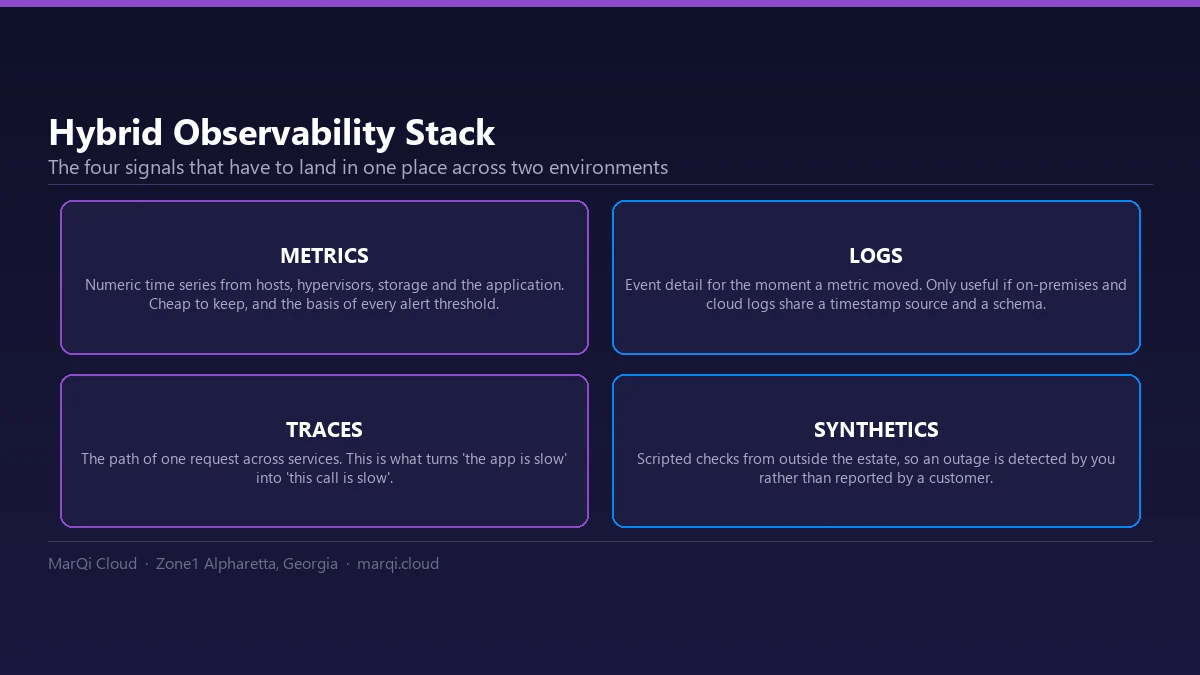
The observability stack is typically built around three key pillars: metrics, logs, and traces. Each of these components plays a vital role in providing a comprehensive view of system performance.
Metrics
Metrics are numerical representations of data points collected over time. They provide quantitative insights into system performance, allowing teams to monitor key performance indicators (KPIs) and detect anomalies. Common metrics include:
- CPU utilization
- Memory usage
- Response times
- Request rates
Implementing metrics first is often recommended because they provide a high-level overview of system health and performance. Metrics can be easily aggregated and visualized, making it simple to spot trends and anomalies.
Logs
Logs are records of events that occur within a system. They provide detailed information about system behavior and can help teams troubleshoot specific issues. Logs often contain contextual information such as timestamps, error messages, and user actions.
While metrics give a broad overview, logs provide the granularity needed to diagnose problems. Implementing logs second is beneficial as they complement metrics, allowing teams to investigate issues more deeply.
Traces
Traces provide a detailed view of the interactions between different components of a distributed system. They track requests as they flow through various services, enabling teams to analyze the performance and latency of each component. Traces are essential for understanding complex transactions and pinpointing bottlenecks.
Implementing traces last is often advisable because they require a more sophisticated setup and can generate significant amounts of data. Traces should be integrated once metrics and logs are in place, providing a complete picture of system performance.
Choosing What to Implement First
When deciding what to implement first in your observability stack, consider the following factors:
1. Complexity of Your Environment
If your systems are relatively simple, starting with metrics may be sufficient. However, if you operate in a microservices architecture or have a complex environment, you may want to implement logs first for better visibility into interactions.
2. Team Expertise
Assess the expertise of your team. If your team is more familiar with metrics, it makes sense to start there. Conversely, if they have experience with logging frameworks, you may want to prioritize logs.
3. Immediate Business Needs
Consider your organization’s immediate needs. If you are facing performance issues, implementing metrics first can help you identify and address those problems quickly. If debugging is a priority, starting with logs may be more beneficial.
4. Tooling and Integration
Evaluate the tools you already have in place. Some observability tools specialize in metrics collection, while others focus on logs or traces. Choose the component that aligns best with your existing infrastructure.
Best Practices for Implementing an Observability Stack
To maximize the effectiveness of your observability stack, consider the following best practices:
1. Define Clear Objectives
Establish clear objectives for your observability initiatives. Determine what you want to achieve, whether it’s improving performance, reducing downtime, or enhancing user experience.
2. Standardize Metrics and Logging Practices
Develop standardized practices for collecting metrics and logs. Consistency is key to ensuring that the data is reliable and can be effectively analyzed.
3. Automate Data Collection
Automate the collection of metrics, logs, and traces to reduce manual effort and ensure that data is consistently captured.
4. Invest in Visualization Tools
Use visualization tools to create dashboards that provide a clear and intuitive view of your system’s performance. Effective visualization helps teams quickly identify issues and trends.
5. Foster a Culture of Observability
Encourage a culture of observability within your organization. Ensure that all team members understand the importance of observability practices and how to leverage the data collected.
Conclusion
Implementing an observability stack is essential for modern organizations seeking to enhance their system performance and reliability. By focusing on metrics, logs, and traces, teams can gain valuable insights into their applications and services. Determining what to implement first depends on various factors, including the complexity of your environment, team expertise, and immediate business needs. By following best practices and fostering a culture of observability, organizations can leverage their observability stack to achieve greater operational excellence.
FAQs
1. What is the difference between metrics, logs, and traces?
Metrics provide quantitative data about system performance, logs offer detailed records of events, and traces track the flow of requests through a system.
2. Why is observability important for businesses?
Observability helps businesses detect and resolve issues faster, improve application performance, and enhance user experiences.
3. What should I implement first in my observability stack?
It’s generally recommended to start with metrics, followed by logs and then traces, but the best choice depends on your specific environment and needs.
4. How can I ensure consistent data collection?
Develop standardized practices for collecting metrics and logs, and consider automating the data collection process.
5. What tools can I use for observability?
There are various tools available for observability, including Prometheus for metrics, ELK Stack for logs, and Jaeger or OpenTelemetry for traces.
6. How can visualization tools help with observability?
Visualization tools create dashboards that provide a clear view of system performance, helping teams quickly identify issues and trends.
7. Can observability improve user experience?
Yes, by identifying and resolving performance issues, observability practices can lead to a smoother and more reliable user experience.
8. How does observability relate to DevOps practices?
Observability is a key component of DevOps, enabling teams to monitor, troubleshoot, and optimize their systems continuously.
9. What are some common challenges in implementing an observability stack?
Common challenges include data overload, integrating multiple tools, and ensuring data accuracy and consistency.
10. How often should I review my observability practices?
Regular reviews are essential to keep your observability practices aligned with changing business needs and technological advancements.